Canopy Heights from LiDAR - Chain Lakes Wilderness Area
In 2019 and 2020 N.S. scanned the forested lands with LIDAR and from this the forest canopy height were determined. The maps on this page use false color to show the heights of the trees.
| COLOR | Approx. Height |
| Dark Blue | 0 |
| Light Blue | 8 m |
| Green | 15 m |
| Yellow | 18 m |
| Orange | 22 m |
| Red | 26 m |
| Dark Red | 30 m |
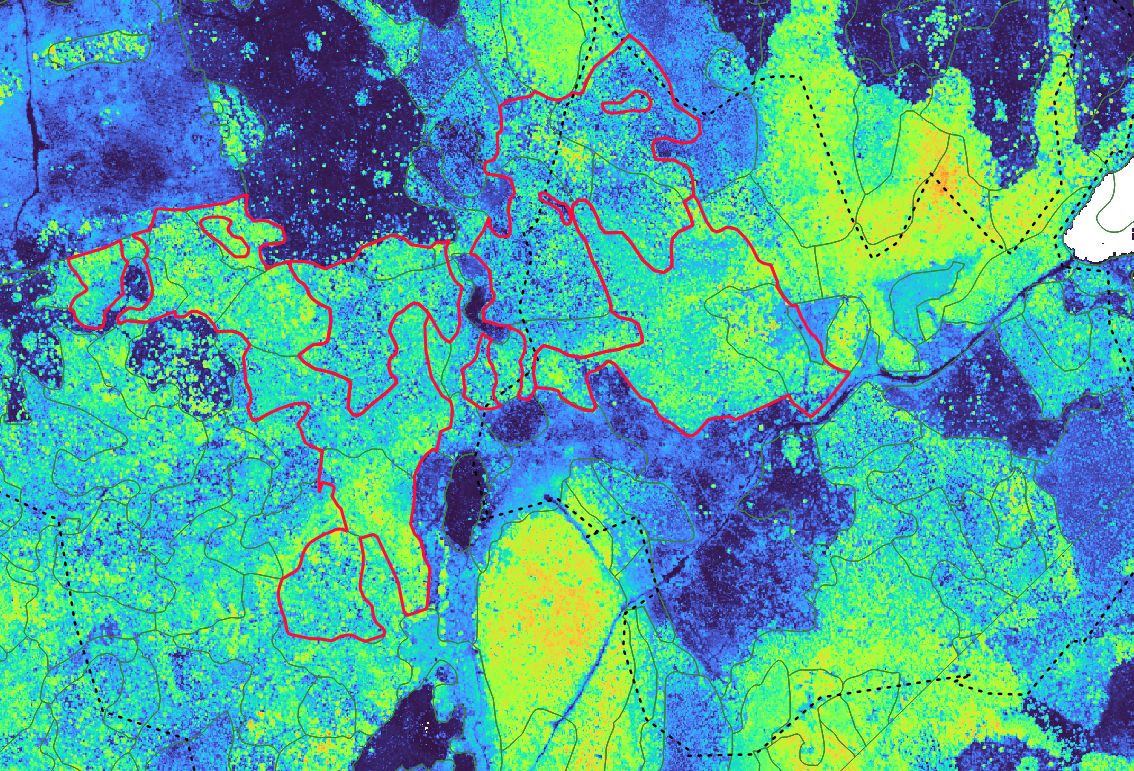
Chain Lake Area Forest Canopy Height from Lidar
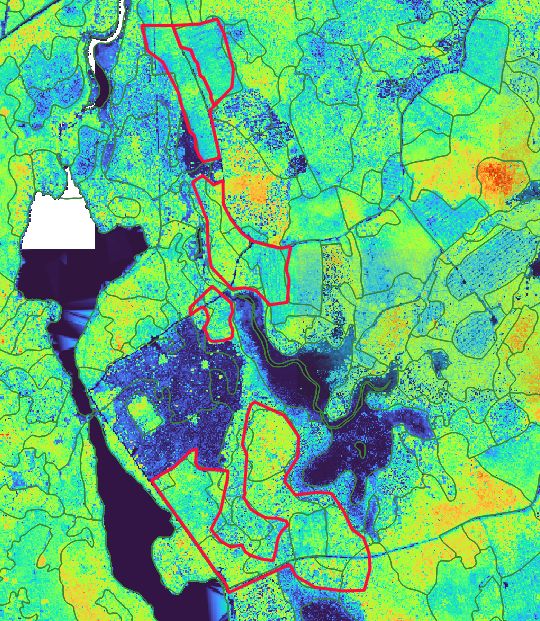
County Line Area Forest Canopy Heights
Note: The dashed lines show where wildlife surveys were done looking for species at risk.
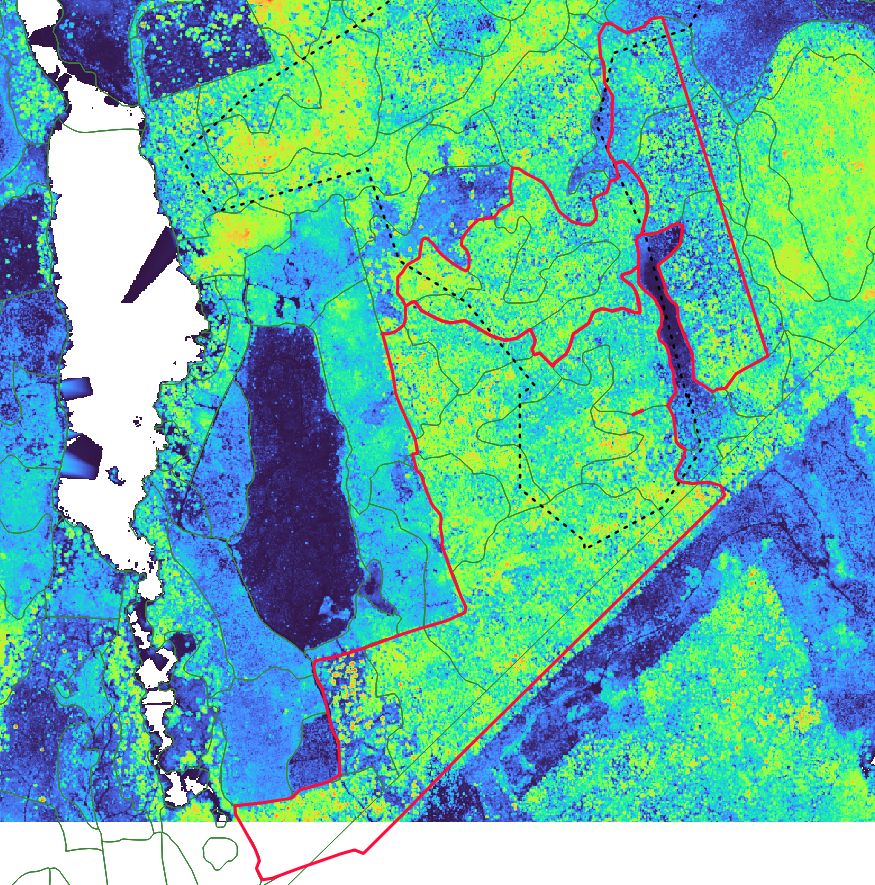
Gully Lake Area Forest Canopy Heights
Note: The dashed lines show where wildlife surveys were done looking and finding species at risk.